FarmAssistance
What Is NDVI? A Farmer's Guide to Satellite Crop Health Monitoring
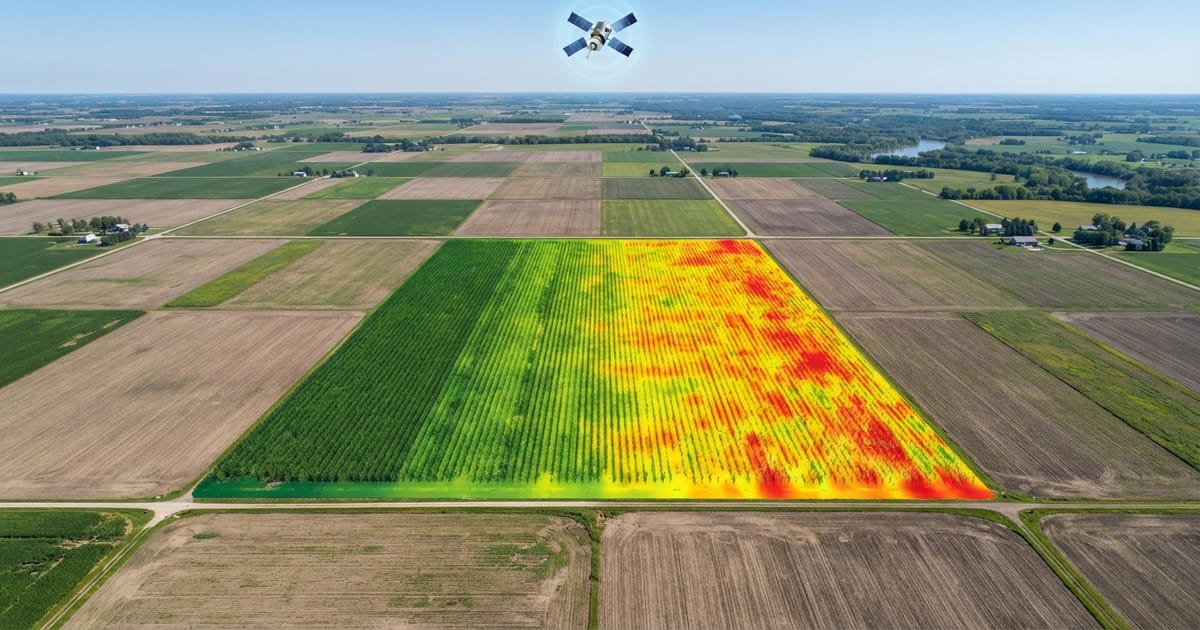
By the time crop stress is visible to the eye from the edge of a field, it's often already cost you yield. Satellite vegetation monitoring — specifically NDVI — exists to catch that stress earlier, from data that's free and updated every few days. Here's what it actually is, what it's good at, and where it falls short.
What NDVI actually measures
NDVI stands for Normalized Difference Vegetation Index. It's calculated from how a surface reflects two specific wavelengths of light captured by a satellite: red light and near-infrared (NIR) light. Healthy, actively photosynthesizing plant tissue absorbs most red light (for photosynthesis) but reflects most near-infrared light. Bare soil, water, and stressed or sparse vegetation reflect red and near-infrared light much more similarly.
The NDVI formula compares those two reflectance values and produces a number between −1 and 1:
- Close to 1: dense, healthy, actively growing vegetation.
- Around 0.2–0.5: sparse or moderately stressed vegetation, or early-stage crop growth.
- Near 0 or negative: bare soil, water, or non-vegetated surfaces.
The most widely used free source for this data is the Sentinel-2 satellite constellation, part of the European Copernicus program — publicly funded, globally available imagery, typically revisited every few days depending on cloud cover and location.
Bare soil / water
≈ 0 or below
Sparse or stressed vegetation
≈ 0.2–0.5
Dense, healthy vegetation
≈ 0.5–1
NDVI from Sentinel-2 satellite imagery, on a −1 to 1 scale.
What NDVI is actually good for
- Spotting stress before it's visible on the ground. A patch of field under water, nutrient, or pest stress often shows a measurable NDVI dip before the color change is obvious walking the field.
- Comparing zones within one field. Uneven NDVI across a field can point to drainage issues, compaction, or variable soil fertility worth investigating on the ground.
- Tracking a trend over the season. A single NDVI reading matters less than whether it's rising as expected for the crop's growth stage, or unexpectedly flat or falling.
What NDVI can't tell you
NDVI is a proxy for plant vigor, not a diagnosis. A low reading tells you something is different about that area — it doesn't tell you if it's drought stress, disease, a nutrient deficiency, pest damage, or just a low spot that floods after rain. It also has real limits:
- Cloud cover blocks the satellite entirely for that pass — there's no reading for a field hidden under cloud that day.
- Very early-season growth and near-harvest senescence both produce naturally low NDVI that isn't "stress" — it's normal for that stage.
- NDVI reflects the crop canopy, not what's happening below ground — it won't tell you root health or soil nutrient levels directly.
Used well, NDVI is a prioritization tool: it tells you where to walk the field and look closer, not what you'll find when you get there.
Combining NDVI with your own records
NDVI is most useful next to what you already know about the field — recent irrigation, the last fertilizer application, planting date, and crop stage. A dip that lines up with a known dry spell tells a different story than the same dip on a field you irrigated yesterday.
FarmAssistance's Field Health Score combines real Sentinel-2 NDVI data with your own field records — irrigation, tasks, and recent activity — into one score per field, so a satellite reading is read alongside what you actually know about that field, not in isolation.
Get the appIf you're also tracking soil moisture as part of your irrigation decisions, see our guide to soil-moisture-based irrigation scheduling — the two data sources answer different questions and work well together.